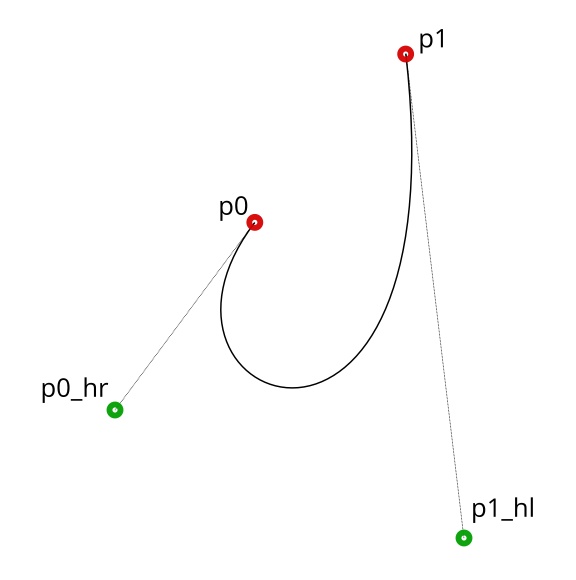
Bezier curves are drawing by four points: two main points (p0, p1) and two handle points (p0_hr, p1_hl).
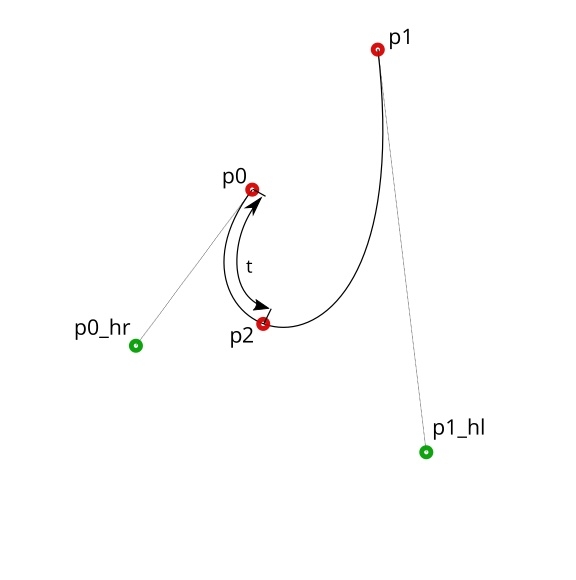
To add an additional point p2 to a curve at a moment t, with t changes from 0 to 1 and represents the ratio of the p2 point location to the total length of the curve, we need to do the following:
What we have to start:
- coordinates of the p0 and p1 points
- p0_hr – coordinates of the right handle point for p0
- p1_hl – coordinates of the left handle point for p1
- t ratio
We need to find:
- coordinates of the new p2 point
- coordinates of its two handle points (left and right)
- new p0_hr and p1_hl control points coordinates
Let’s divide the segments [p0, p0_hr], [p0_hr, p1_hl] and [p1_hl, p1] with the t1, t2, and t3 points in the ratio t along their length.
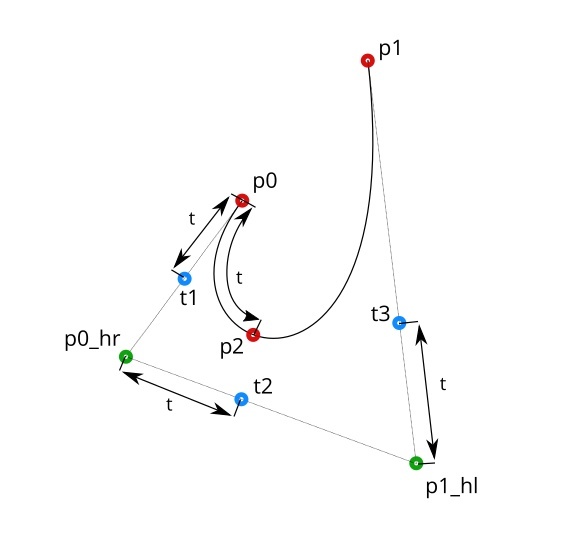
The coordinates of these points can be found with vector math. The point coordinates data is the vector from the world origin (0,0,0) to this point.
How it looks for the t1 point:

Having the original vectors (p0) and (p0_hr) we can find the (v1) vector as the difference of (p0) and (p0_hr):
|
1 |
v1 = p0_hr - p0 |
Having the t ratio, we can get the (v2) vector:
|
1 |
v2 = v1 * t |
The addition of the (v2) and (p0) vectors gives us the desired vector (t1):
|
1 |
t1 = v2 + p0 |
Combine all for t1:
|
1 |
t1 = p0 + (p0_hr - p0) * t |
Similarly for t2 and t3 points:
|
1 2 |
t2 = p0_hr + (p1_hl - p0_hr) * t t3 = p1_hl + (p1 - p1_hl) * t |
We found the t1 and t3 points which are the coordinates of the new positions of the handle points for p0 and p1.
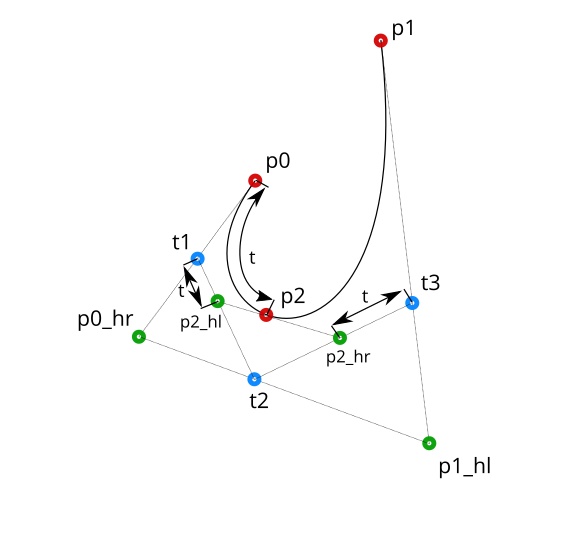
Next, find the coordinates of the handle points for p2.
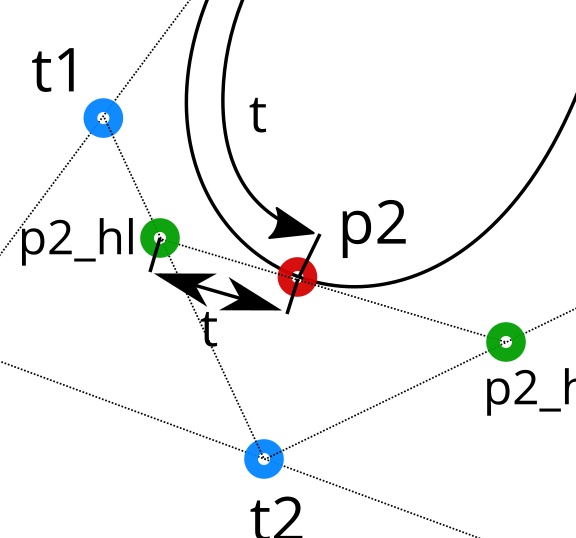
Connect the t1, t2 and t2, t3 points. Now we can get handle points for p2, by the same t ratio.
|
1 2 |
p2_hl = t1 + (t2 - t1) * t p2_hr = t2 + (t3 - t2) * t |
It remains to find the p2 point coordinates.
Connect the p2_hl and p2_hr points. We can find the desired p2 point by the same t ratio.
|
1 |
p2 = p2_hl + (p2_hr - p2_hl) * t |
We found all expressions to get all the necessary points. Now we can leave the math and write a function to find an additional point on the Bezier curve with all the necessary handle points.
|
1 2 3 4 5 6 7 8 |
def new_bezier_point (p0, p0hr, p1hl, p1, t): t1 = p0 + (p0hr - p0) * t t2 = p0hr + (p1hl - p0hr) * t t3 = p1hr + (p1 - p1hl) * t p2hl = t1 + (t2 - t1) * t p2hr = t2 + (t3 - t2) * t p2 = p2hl + (p2hr - p2hl) * t return [t1, p2hl, p2, p2hr, t3] |
Now we can add a new point to the Bezier curve and configure the coordinates of all the necessary points.
|
1 2 3 4 5 6 7 8 9 10 11 12 13 14 15 16 17 18 |
p0co = p0.co p0hr = p0.handle_right p1co = p1.co p1hl = p1.handle_left new_data = new_bezier_point(p0co, p0hr, p1hl, p1co, 0.3) bpy.ops.curve.subdivide(1) p0.handle_right_type = 'FREE' p0.handle_right = new_data[0] p1.handle_left_type = 'FREE' p1.handle_left = new_data[4] p2.co = new_data[2] p2.handle_left_type = 'FREE' p2.handle_right_type = 'FREE' p2.handle_left = new_data[1] p2.handle_right = new_data[3] |
Thank you for a nice visualisation. Just one little error I found: diagram 5-1 the ‘t’ between t2 and t3 is on the wrong side of p2_hr.
Thank you for the correction!